Context and problem
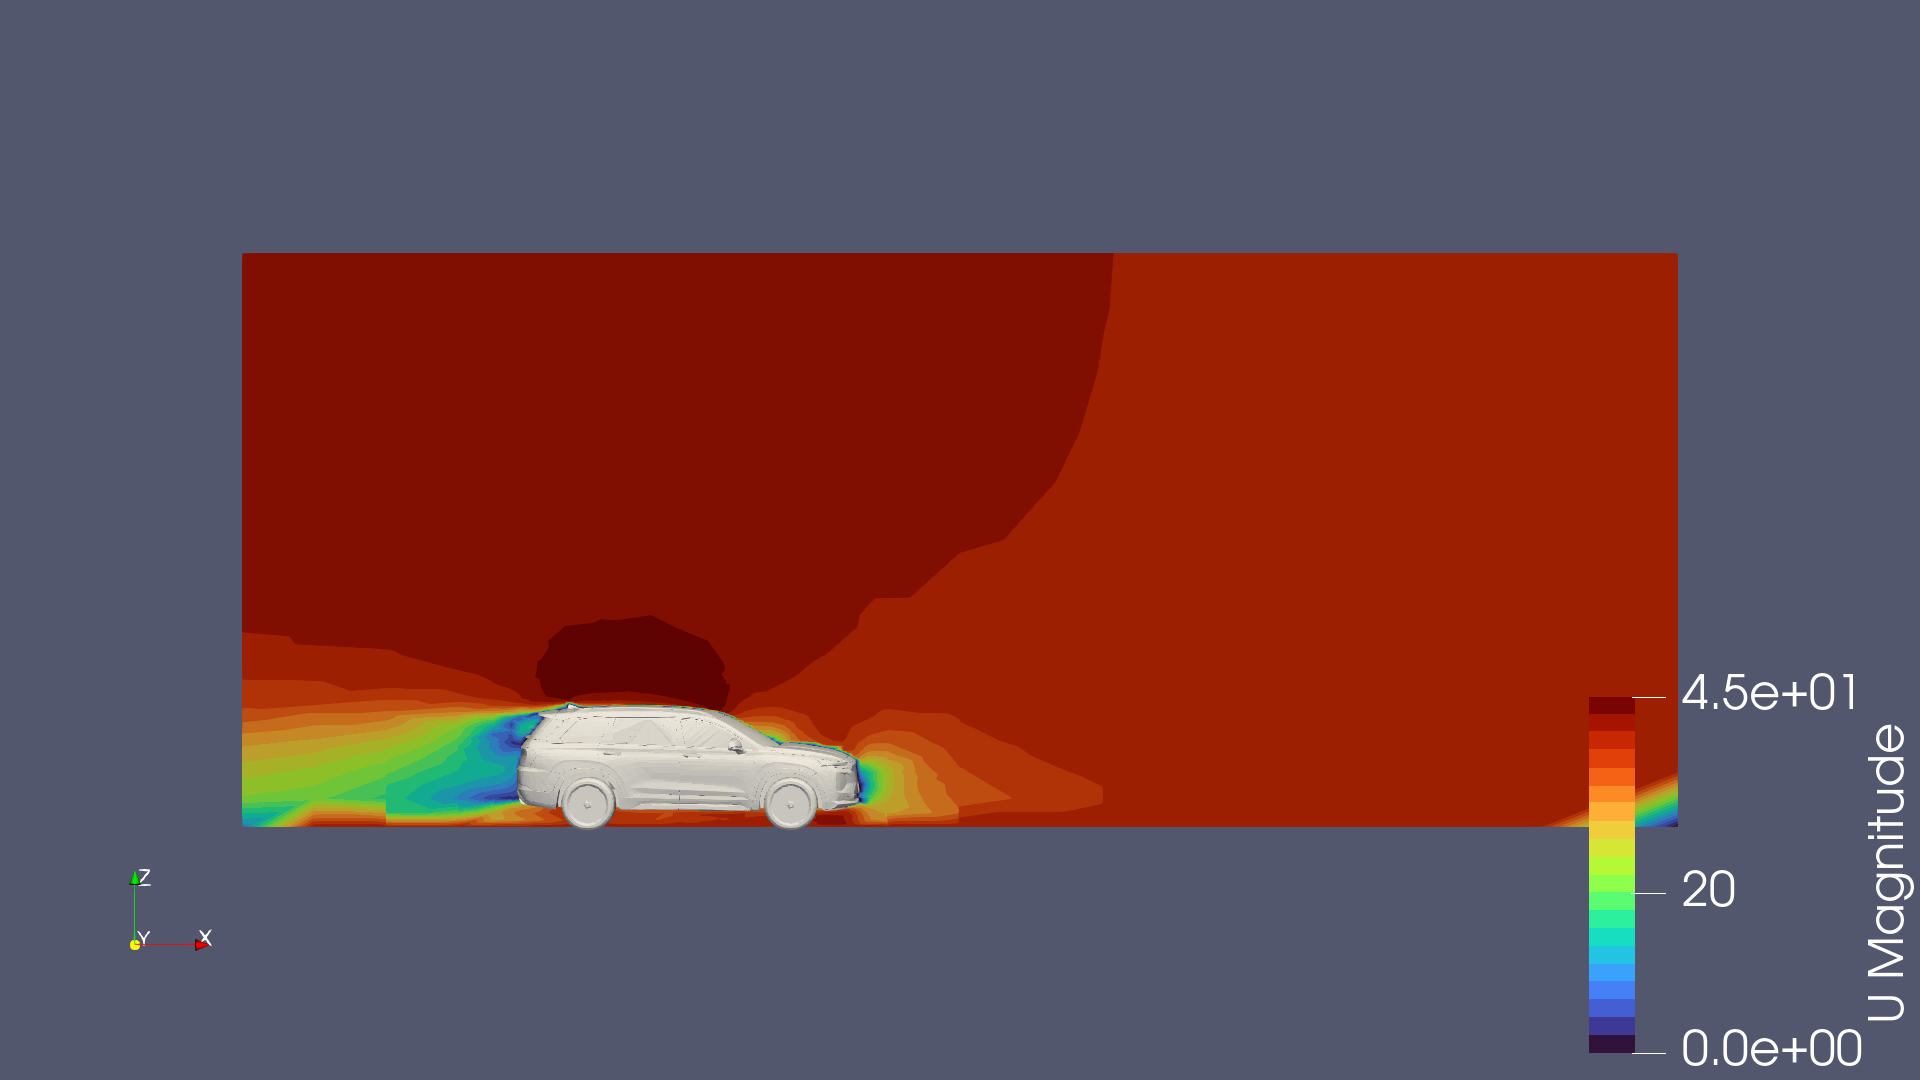
Opening a vehicle’s windows changes the airflow around its body and cabin. I investigated how that change affected aerodynamic drag in a digital wind tunnel, using a model of a 2020 Hyundai Santa Fe. The original question included air-conditioning use, but the simulations compared window configurations; they did not measure an air-conditioning load or fuel consumption. [1]
My role and contributions
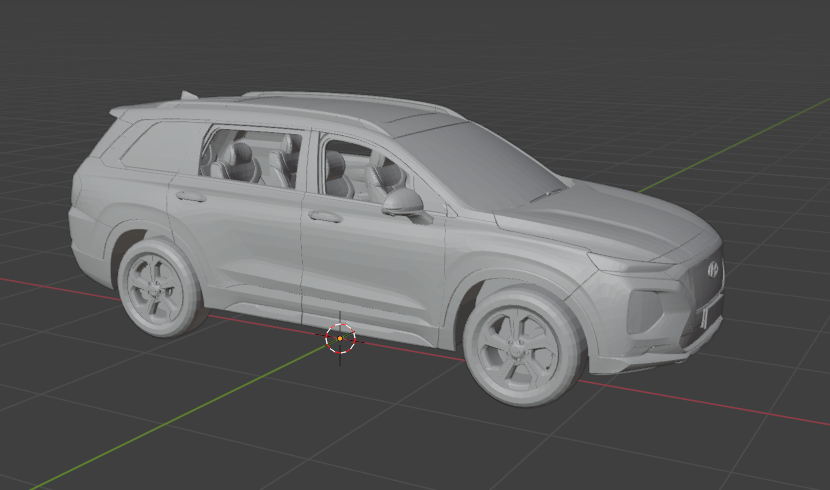
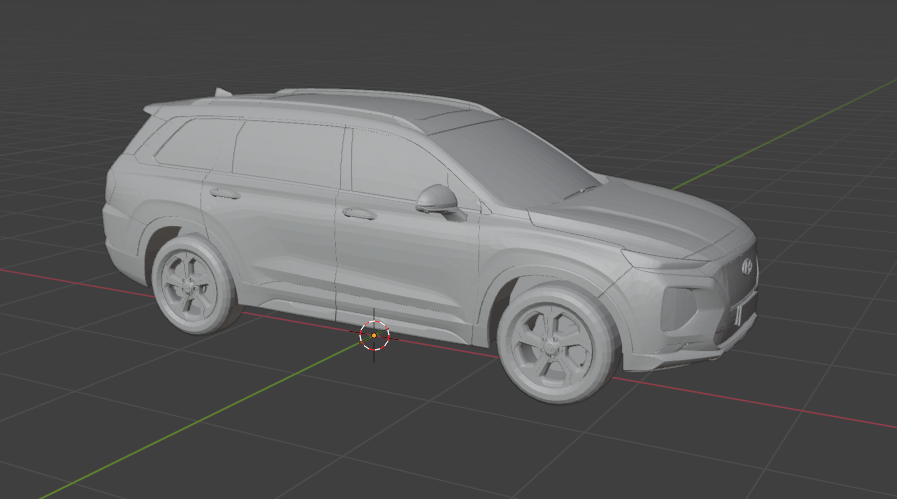
I edited an imported vehicle model in Blender to create open- and closed-window configurations, ran the SimFlow/OpenFOAM simulations, processed the drag-force outputs in Excel and Python, and examined the flow fields in ParaView. The assessment was completed in April 2025. [1], [2]
Methods and tools
- Test matrix: airflow speeds of 5, 10, 20, 30, and 40 m/s; two window configurations; and 500, 1,000, and 1,500 solver iterations per condition, giving 30 simulation runs. [1], pp. 9–12.
- Flow model: incompressible air, a k–ω SST turbulence model, a moving ground boundary, and a no-slip vehicle surface. The report specifies an air density of 1.225 kg/m³. [1], pp. 5–7.
- Geometry: Blender 4.2.3 edits to an imported STL model. A frontal bounding rectangle supplied an approximate reference area of 3.86 m²; it was not an exact projected silhouette measurement. [1], pp. 8–10.
- Analysis: drag-force comparisons, drag-coefficient calculations, uncertainty propagation, and velocity-contour visualization. The iteration comparisons checked numerical sensitivity; there was no physical wind-tunnel validation. [1], pp. 12–22.
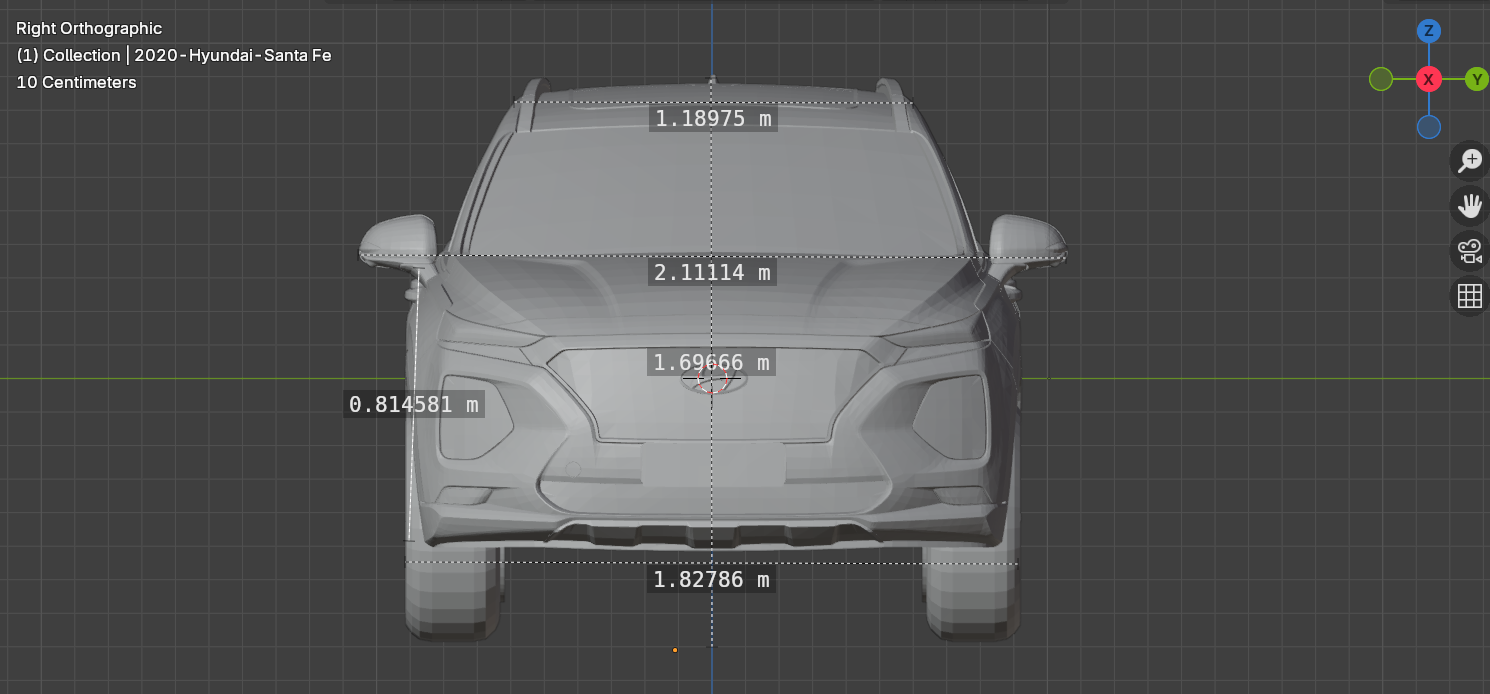
Approximate frontal reference area measured in Blender. [1], table 3.
Results
The report recorded greater drag for the open-window configuration at each tested airflow speed. At 40 m/s, it reported the following force and power values. [1], pp. 20–21.
| Window configuration | Drag force (N) | Aerodynamic power (kW) |
|---|---|---|
| Closed | 1,056.67 | 42.267 |
| Open | 1,095.98 | 43.839 |
Using (P = F_d v), the report calculated an additional aerodynamic power demand of approximately 1.57 kW with open windows at 40 m/s. Maintaining that condition for one hour would require approximately 5.66 MJ of additional aerodynamic work. These are calculated mechanical quantities, not a measured fuel-consumption or air-conditioning comparison. [1], p. 20.
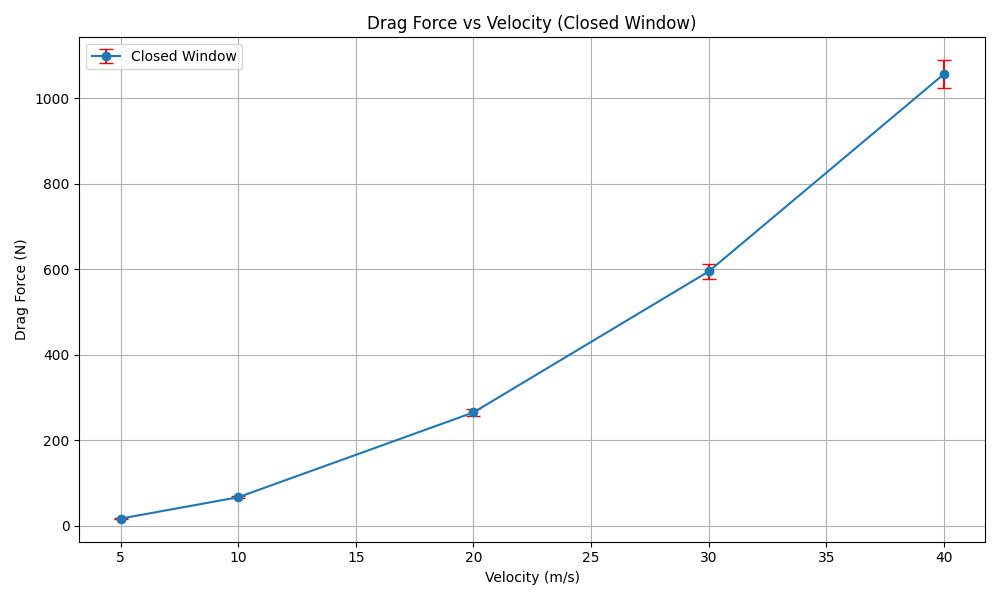
Closed-window drag-force trend from the assessment. The data are numerical simulation outputs. [1], graph 1.
Outcomes, limitations, and next steps
The study connected changes in vehicle geometry to simulated force and power demand. Its limitations included simplified underbody geometry, omitted wheel rotation, idealized flow conditions, and the absence of physical testing. The report proposed mesh refinement, crosswind cases, rotating wheels, and a separate efficiency model as possible extensions. [1], pp. 21–22.
The report’s summary drag coefficients do not reconcile with its per-speed table. I have omitted those averages and the percentage derived from them until the original calculation is checked. The study therefore supports a comparison of the two simulated geometries within its stated assumptions, without establishing a general fuel-saving recommendation. [1], table 10 and pp. 16, 19–20.
References
- [1] S. Garcia Salmeron, “Physics IA – Drag Force,” Physics Internal Assessment, pp. 1–23. Source report retained in the project review archive; download not published.
- [2] S. Garcia Salmeron, “Simon Garcia Salmeron Resume,” ver. 6, p. 1, “Aerodynamic Drag Analysis.” Source résumé retained in the project review archive.