Context and problem
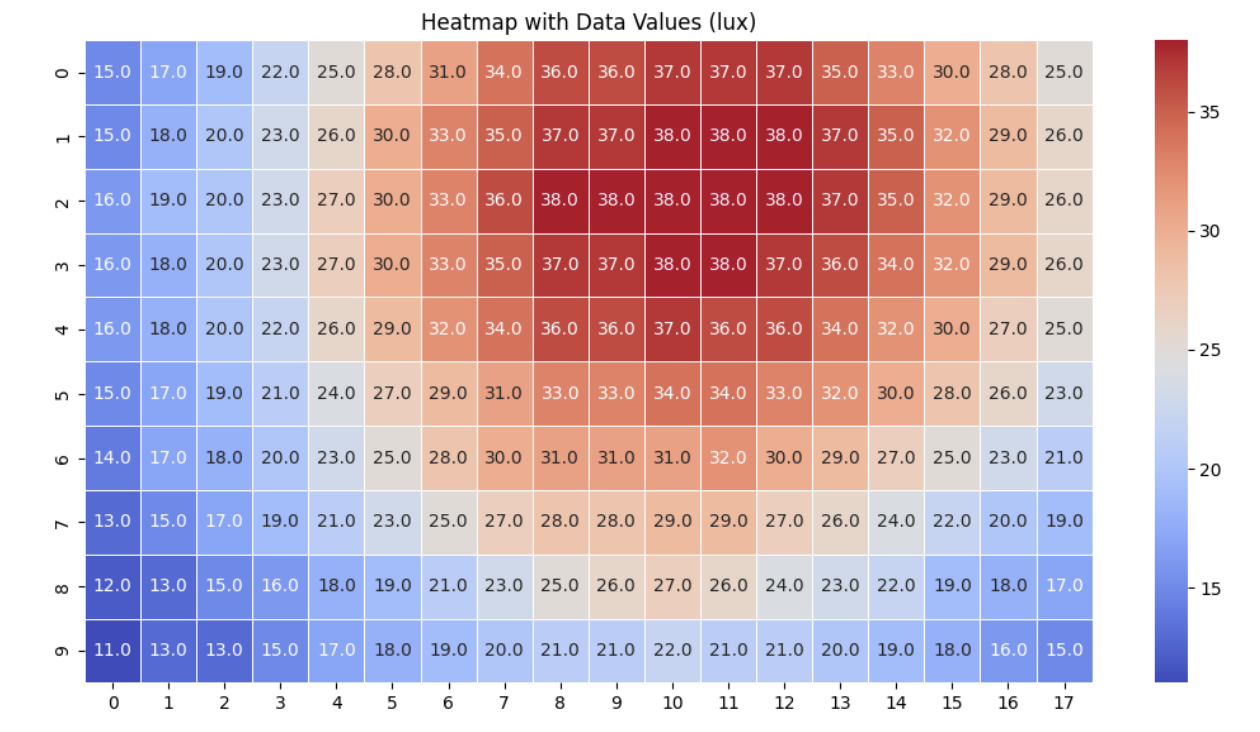
This exploration considered how illumination varied over a desk beneath a single lamp. The preserved project notes describe an inverse-square model and a spatial heatmap, connecting an everyday lighting problem with mathematical modeling. [1]
My role and contributions
My earlier portfolio entry described developing the spatial model and visualizing desk-illumination measurements. The original report, complete dataset, and collaborator record are not available in the current archive, so the extent of individual and shared work remains unverified. [1]
Methods and tools
The earlier notes represented desk positions as points on a plane and related their distance from the lamp to an inverse-square expression. They also included a partial Python plotting example. That example does not contain a complete measurement dataset or a reproducible analysis. [1]
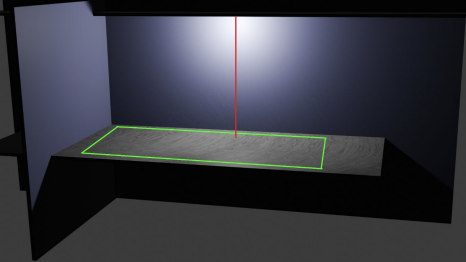
Desk geometry illustration from the earlier entry. [1]
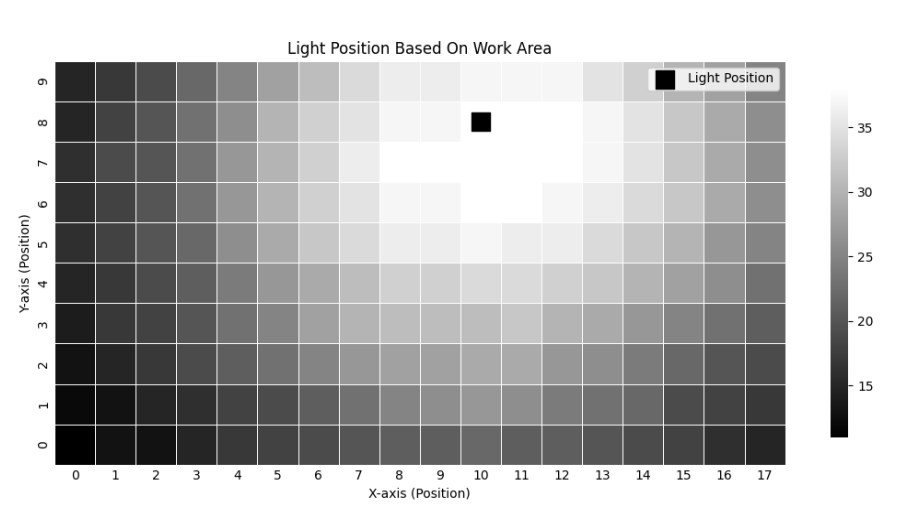
Light-position diagram used in the spatial model. [1]
Results
The surviving heatmap and geometry diagrams document the visual presentation of the exploration. They do not, by themselves, establish measurement accuracy, model agreement, or illumination efficiency. I have withheld the earlier numerical sample-count, measurement-spacing, and validation claims until they can be checked against the original report and measurements. [1]
Outcomes, limitations, and next steps
The materials preserve a connection between spatial geometry and desk-lighting visualization. A fuller evaluation requires the original model assumptions, lamp and instrument information, complete measurements, and a comparison between predicted and observed illuminance. The simplified expression also needs its illumination geometry reviewed before it is presented as a validated desk-plane model. [1]
References
- [1] “Mapping the Illumination of a Desk,” earlier portfolio entry and associated images, source snapshot
07bd891, archived Oct. 1, 2026. Primary study report and complete measurements were not supplied.