Context and problem
Direct ink writing research uses both programmed nozzle paths and post-print microscopy. The suite brought toolpath visualization, line-width analysis, and image-intensity analysis into a shared desktop interface for the Lee Research Group at the University of St. Thomas. [1]–[4]
My role and contributions
I developed the Python tool suite and co-developed calibrated line-width analysis with a research partner. That work used automated edge detection and CSV measurement exports to support experimental analysis. The available résumé identifies the shared contribution but does not name the partner or assign every module individually. [6]
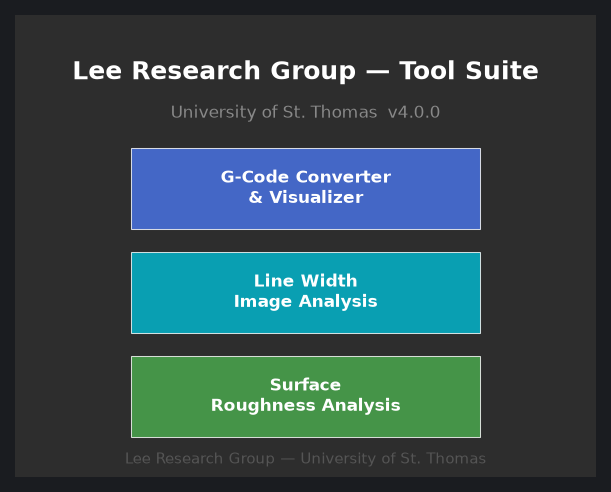
Illustrative launcher layout, not a captured application screenshot. [5]
Methods and tools
Toolpath visualization
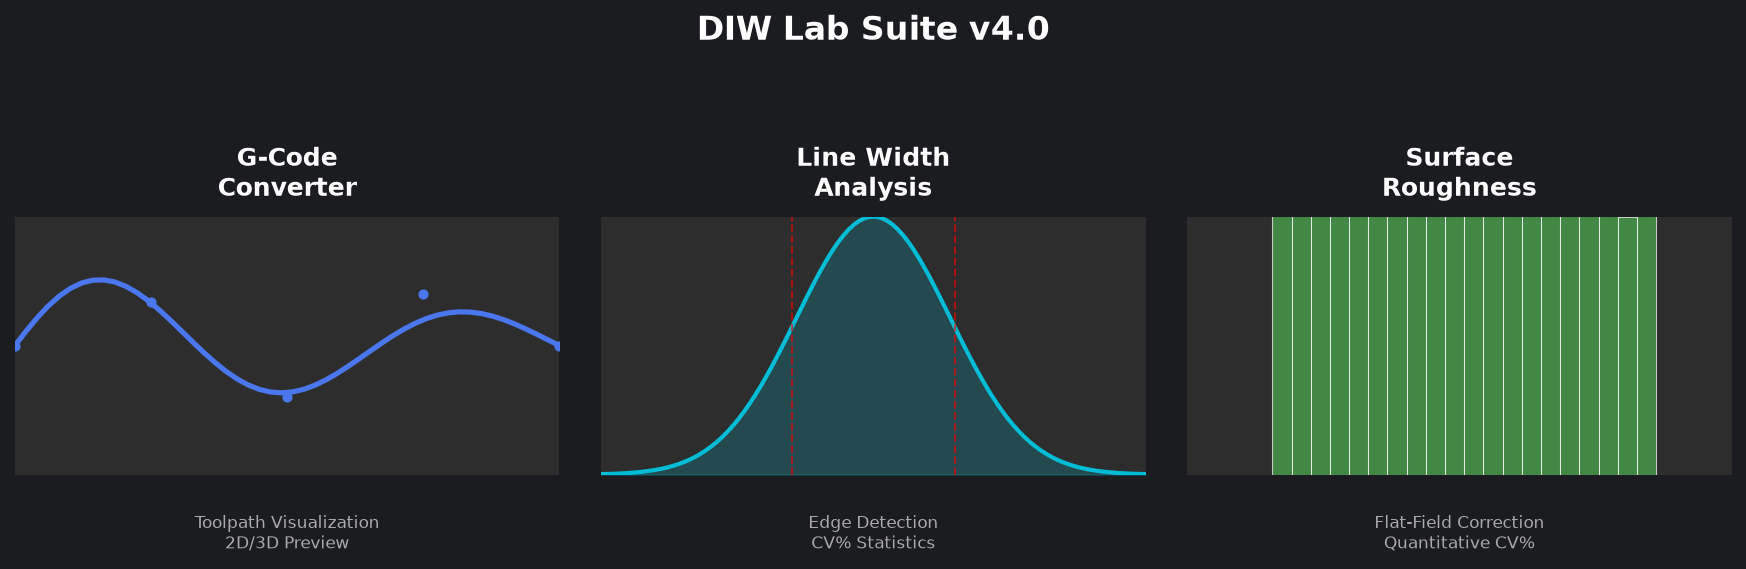
The parser implements linear and arc motion handling, position/unit tracking, variables, and layer grouping. Matplotlib renders the parsed paths, and the interface provides 2D and 3D views. These implemented features do not establish compatibility with every G-code or AeroScript program. [1], [4]
Line-width microscopy analysis
The image-analysis engine supports automatic Otsu or user-selected thresholding, row-wise edge tracking, overlap reconciliation, and measurement exports. It reports a classical coefficient of variation from the mean and standard deviation, plus a median/MAD-based robust statistic. Edge overlays and row logs allow the detected boundaries to be inspected alongside the measurements. [2]
Image-intensity variation
The module labeled “Surface Roughness Analysis” computes the mean, standard deviation, and coefficient of variation of grayscale intensity within a selected region, with exclusion masks and an optional illumination correction. Its output describes image-intensity variation; it does not measure surface height or establish a calibrated Ra or Rq roughness value. [3]
Interface and organization
The implementation uses Python, Tkinter/ttkbootstrap, NumPy, OpenCV, and Matplotlib. Computational and interface code reside in separate modules, with shared interface components. A PyInstaller specification is included in the source tree. [1]–[4]
Results and outputs
The source implements toolpath plots, line-width profiles, image overlays, intensity histograms, and CSV summaries. These outputs support inspection and traceability of the analysis settings. No measured speedup, accuracy benchmark, physical-roughness calibration, or deployment certification is claimed here. [1]–[4]
Outcomes, limitations, and next steps
The suite organized related laboratory analysis tasks around a shared launcher and export workflow. Line-width results depend on image calibration, boundary detection, and frame alignment; intensity results also depend on illumination and masking. The included source does not establish that the packaged executable matches every source module. [1]–[4]
The next verification steps are to compare automated widths with reference measurements, review the illumination-correction mask behavior, and confirm the packaged application’s imports and required assets. Unpublished experimental results and microscopy examples remain outside this portfolio entry.
References
- [1] Lee Research Group, “gcode_engine.py,” DIW Lab Suite source, parser and rendering functions.
- [2] Lee Research Group, “line_width_engine.py,” DIW Lab Suite source, edge tracking, stitching, statistics, and export functions.
- [3] Lee Research Group, “surface_roughness_engine.py,” DIW Lab Suite source, intensity-analysis and masking functions.
- [4] Lee Research Group, DIW Lab Suite source: launcher, toolpath interface, line-width interface, intensity interface, shared interface components, and PyInstaller specification.
- [5] “generate_diw_images.py,” portfolio illustration-generation script. Source.
- [6] S. Garcia Salmeron, “Simon Garcia Salmeron Resume,” ver. 6, p. 1, “Lee Research Group Tool Suite.” Source résumé retained in the project review archive.